✅Utah County Map
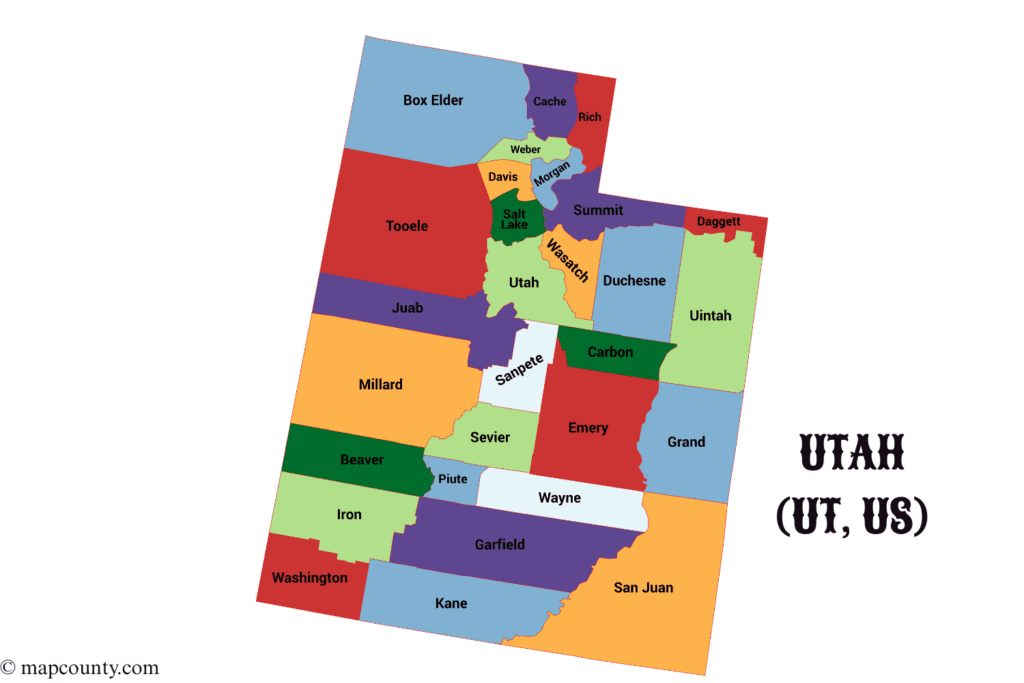
Counties are the main substate units used for records, mapping, and many everyday tasks. This page keeps the focus on all 29 Utah counties first, then adds a few compact notes that help people use county-level data well.
Why counties matter
- Addresses and services often key off county boundaries.
- Public records such as property, court, and permit records are commonly organized by county.
- Data work uses county FIPS codes to join datasets cleanly.
Useful definitions
County seat is the administrative hub for county services.
FIPS code is a standard numeric ID used in many United States datasets.
Area helps compare scale, while density helps compare how concentrated people are.
All 29 Utah counties with current population estimates
The population columns separate two different Census Bureau measures. 2020 Census is the official decennial count, while 2025 Estimate is the Vintage 2025 resident population estimate for July 1, 2025. The change column compares those two published values. Estimated density uses the 2025 population estimate divided by the listed land area.
| County | County seat | FIPS | Established | Land area sq mi | 2020 Census | 2025 Estimate | Change 2020–2025 | Est. density 2025 / sq mi |
|---|---|---|---|---|---|---|---|---|
| Beaver County | Beaver | 49001 | Jan 5 1856 | 2,590 | 7,072 | 7,301 | +3.2% | 2.8 |
| Box Elder County | Brigham City | 49003 | Jan 5 1856 | 5,746 | 57,666 | 65,320 | +13.3% | 11.4 |
| Cache County | Logan | 49005 | Jan 5 1857 | 1,165 | 133,154 | 145,000 | +8.9% | 124.5 |
| Carbon County | Price | 49007 | Mar 8 1894 | 1,478 | 20,412 | 20,680 | +1.3% | 14.0 |
| Daggett County | Manila | 49009 | Jan 7 1918 | 697 | 935 | 934 | −0.1% | 1.3 |
| Davis County | Farmington | 49011 | Oct 5 1850 | 299 | 362,679 | 381,227 | +5.1% | 1,275.0 |
| Duchesne County | Duchesne | 49013 | Jan 4 1915 | 3,241 | 19,596 | 20,856 | +6.4% | 6.4 |
| Emery County | Castle Dale | 49015 | Feb 12 1880 | 4,462 | 9,825 | 10,177 | +3.6% | 2.3 |
| Garfield County | Panguitch | 49017 | Mar 9 1882 | 5,175.15 | 5,083 | 5,256 | +3.4% | 1.0 |
| Grand County | Moab | 49019 | Mar 13 1890 | 3,672 | 9,669 | 9,790 | +1.3% | 2.7 |
| Iron County | Parowan | 49021 | Jan 31 1850 | 3,297 | 57,289 | 67,141 | +17.2% | 20.4 |
| Juab County | Nephi | 49023 | Mar 3 1852 | 3,392 | 11,786 | 13,567 | +15.1% | 4.0 |
| Kane County | Kanab | 49025 | Jan 16 1864 | 3,990 | 7,667 | 8,597 | +12.1% | 2.2 |
| Millard County | Fillmore | 49027 | Oct 4 1851 | 6,572 | 12,975 | 14,057 | +8.3% | 2.1 |
| Morgan County | Morgan | 49029 | Jan 17 1862 | 609 | 12,295 | 13,383 | +8.8% | 22.0 |
| Piute County | Junction | 49031 | Jan 16 1865 | 758 | 1,438 | 1,509 | +4.9% | 2.0 |
| Rich County | Randolph | 49033 | Jan 16 1864 | 1,029 | 2,510 | 2,687 | +7.1% | 2.6 |
| Salt Lake County | Salt Lake City | 49035 | Jan 31 1850 | 742 | 1,185,238 | 1,220,916 | +3.0% | 1,645.4 |
| San Juan County | Monticello | 49037 | Feb 17 1880 | 7,820 | 14,518 | 14,542 | +0.2% | 1.9 |
| Sanpete County | Manti | 49039 | Jan 31 1850 | 1,590 | 28,437 | 31,453 | +10.6% | 19.8 |
| Sevier County | Richfield | 49041 | Jan 16 1865 | 1,911 | 21,522 | 22,827 | +6.1% | 11.9 |
| Summit County | Coalville | 49043 | Jan 13 1854 | 1,872 | 42,357 | 43,141 | +1.9% | 23.0 |
| Tooele County | Tooele | 49045 | Jan 31 1850 | 6,941 | 72,698 | 87,461 | +20.3% | 12.6 |
| Uintah County | Vernal | 49047 | Feb 18 1880 | 4,480 | 35,620 | 38,278 | +7.5% | 8.5 |
| Utah County | Provo | 49049 | Jan 31 1850 | 2,003 | 659,399 | 759,859 | +15.2% | 379.4 |
| Wasatch County | Heber City | 49051 | Jan 17 1862 | 1,176 | 34,788 | 38,514 | +10.7% | 32.8 |
| Washington County | St. George | 49053 | Mar 3 1852 | 2,426 | 180,279 | 213,670 | +18.5% | 88.1 |
| Wayne County | Loa | 49055 | Mar 10 1892 | 2,461 | 2,486 | 2,587 | +4.1% | 1.1 |
| Weber County | Ogden | 49057 | Jan 31 1850 | 576 | 262,223 | 278,174 | +6.1% | 482.9 |
Population source: U.S. Census Bureau, County Population Totals and Components of Change: 2020–2025. Vintage 2025 county totals were released in March 2026 and are the Bureau’s most recent completed, consistent county estimate series. The 2025 figures are estimates, not replacements for the official 2020 Census counts. Percentage changes shown above are calculated from the 2020 Census count to the July 1, 2025 estimate.
How to use Utah county data without getting tripped up
FIPS codes for clean joins
- Utah state code is 49, followed by the 3-digit county code.
- Example: 49049 always means Utah County.
- FIPS stays steady even when county population changes.
County seat is not always the biggest city
County seats are where many official offices cluster. In everyday life, the largest city can be elsewhere in the same county. It happens across the state.
- Use the seat when you need county administration.
- Use the county name when matching datasets or filtering maps.
Fast checks that save time
- Same name, different thing: Utah can mean the state, while Utah County is one county inside the state.
- Area vs population: large area does not mean more people. San Juan County has the largest listed land area, while Salt Lake County has the largest population.
- Density tells a different story: Davis County is small in land area yet has an estimated 2025 density of about 1,275 people per square mile.
- Count vs estimate: use the 2020 Census when you need the official decennial count and the 2025 estimate when you need a newer population measure.
Utah counties by practical region a simple way to think about geography
These groupings are not official. They are a simple way to organize counties for planning, analysis, and search filters.
Wasatch Front core high density
- Davis (very dense)
- Salt Lake (largest population)
- Utah (second-largest population)
- Weber (major urban corridor)
North and mountain counties mix of valleys and peaks
- Box Elder, Cache, Rich
- Morgan, Summit, Wasatch
- Daggett is also in the far northeast corner.
Central Utah wide open, smaller cities
- Juab, Millard, Sanpete
- Sevier, Piute
East and south big landscapes
- Uintah, Duchesne, Carbon, Emery, Grand
- Beaver, Iron, Washington, Kane, Garfield, Wayne, San Juan
Population stats people look up often
Largest counties by population 2025 estimate
- Salt Lake County 1,220,916
- Utah County 759,859
- Davis County 381,227
- Weber County 278,174
- Washington County 213,670
Smallest populations 2025 estimate
- Daggett County 934
- Piute County 1,509
- Wayne County 2,587
- Rich County 2,687
These counties have large geographic footprints relative to population, so density remains low.
Largest percentage increases 2020 Census to 2025 estimate
- Tooele County +20.3%
- Washington County +18.5%
- Iron County +17.2%
- Utah County +15.2%
- Juab County +15.1%
What the change column means
The percentage compares the official 2020 Census count with the 2025 population estimate. It is useful for seeing direction and scale of change, but the two columns remain different types of population measure.
Utah basics kept short
Administrative facts
- State capital: Salt Lake City
- USPS abbreviation: UT
- Counties: 29
- Largest by listed land area: San Juan County
- Most populated: Salt Lake County
Geography in plain terms
- Mountain and valley corridors shape where people live.
- County boundaries often reflect natural features and historic settlement patterns.
- When comparing counties, look at area, population, and density together.
FAQ county focused
How many counties are in Utah?
There are 29 counties in Utah.
What is the fastest way to identify a county in datasets?
Use the 5-digit FIPS code. It stays consistent across many public datasets and reduces name-matching errors.
Does county seat mean the largest city?
No. The county seat is the administrative center. The largest city can be different, especially in fast-growing counties.
Are the 2025 population figures Census counts?
No. The 2020 Census figures are official decennial counts. The 2025 figures are U.S. Census Bureau Vintage 2025 population estimates for July 1, 2025.
Why keep the 2020 Census column if newer estimates are available?
The 2020 Census provides a fixed official count, while the 2025 estimate gives a newer view of population. Keeping both makes it possible to distinguish the decennial baseline from later estimated change.
More USA County Maps
- South Dakota County Map with Cities and Towns [SD, US]
- South Carolina County Map with Cities and Towns [SC, US]
- North Carolina County Map with Cities and Towns [NC, US]
- North Dakota County Map with Cities and Towns [ND, US]
- Wyoming County Map with Cities and Towns [WY, US]
- Wisconsin County Map with Cities and Towns [WI, US]